Analysis · Public data only
Where your patients go, and what keeping them is worth.
Rural patients often leave the county for care, and most of what a hospital leader hears about fixing it is a vendor pitch. This tool starts from where patients are admitted, then prices each way to keep care local under critical access hospital payment rules.
PythonJavaScript (Node 18+)openpyxlClaude Code
01 · At a glance
The question, the data, and the terms.
The scan is built around one question from a rural hospital CEO. It reads public files only. A hospital can add its own aggregate counts, but it doesn’t have to.
- The question
- Where can AI keep patients from leaving the county?
- Who it’s for
- CEOs and CFOs of rural and critical access hospitals.
- Data
- Public data only, with no patient data.
- CMS Hospital Service Area File, calendar years 2015–2025
- Medicare Inpatient Hospitals by Provider, and by Provider and Service
- Medicare Geographic Variation by county, and Medicare Monthly Enrollment
- Provider of Services, Rural Health Clinic Enrollments, and Medicare Telehealth Trends
- HCRIS cost reports (Form 2552-10)
- Census ACS 5-year estimates for 2020–2024, the ZCTA-to-county file, the 2024 ZCTA Gazetteer, and TIGERweb boundaries
- To run it
- A run is started in Claude Code with
/outmigration-assessmentand the hospital’s CMS certification number. It downloads about 500 MB of public files and takes 10–20 minutes. - Status
- A working tool, with a sample report. Built by Tyler Wallace at Scale Street, with Claude Code.
- Rights
- © 2026 Tyler Wallace. Hospitals and health systems may run and modify this tool to assess their own outmigration, for internal use. Reselling it, redistributing it or offering it as a service to others needs written permission.
02 · What it does
One page for the CEO, one workbook for the CFO.
The briefing gives the answer on a single page. The workbook behind it sources every figure, so the CFO can check the math.
It starts from where patients go
The scan reads CMS files to see which hospitals a county’s Medicare patients are admitted to. The starting point is the patient’s actual destination, not a list of AI products.
It ranks the moves
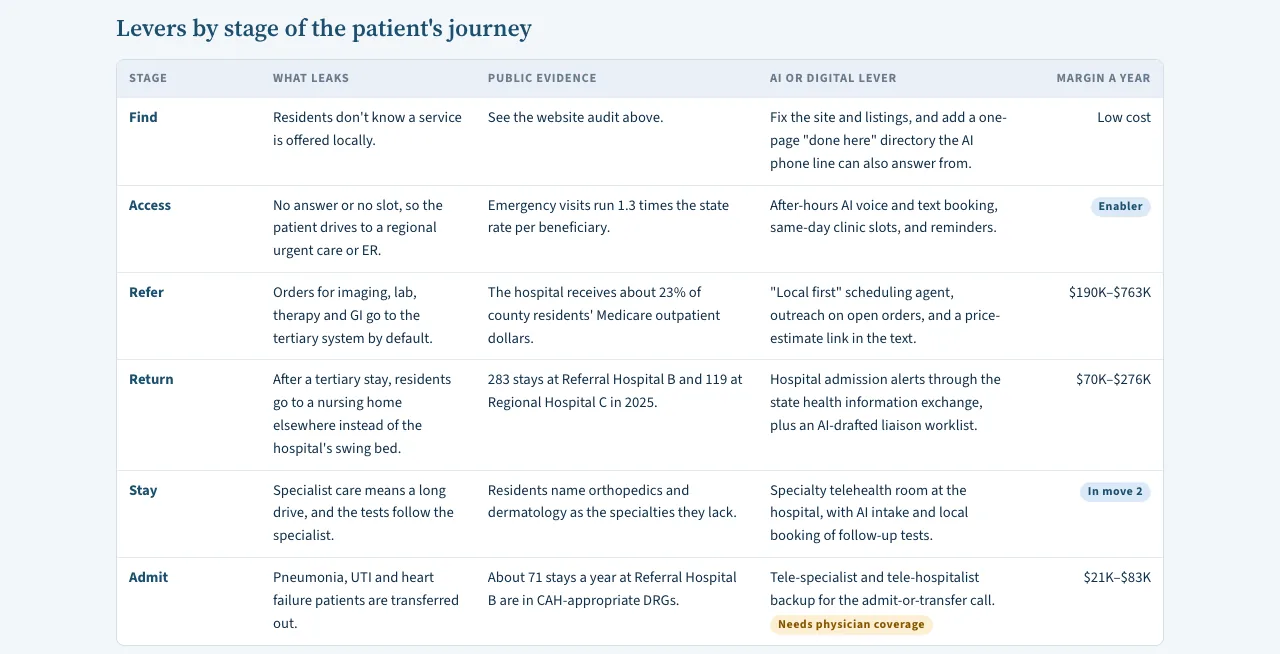
It ranks digital front door moves, such as after-hours phone and text booking, or bringing residents home to a swing bed. Each move is valued as a change in the hospital’s annual operating margin.
It prices them under critical access payment rules
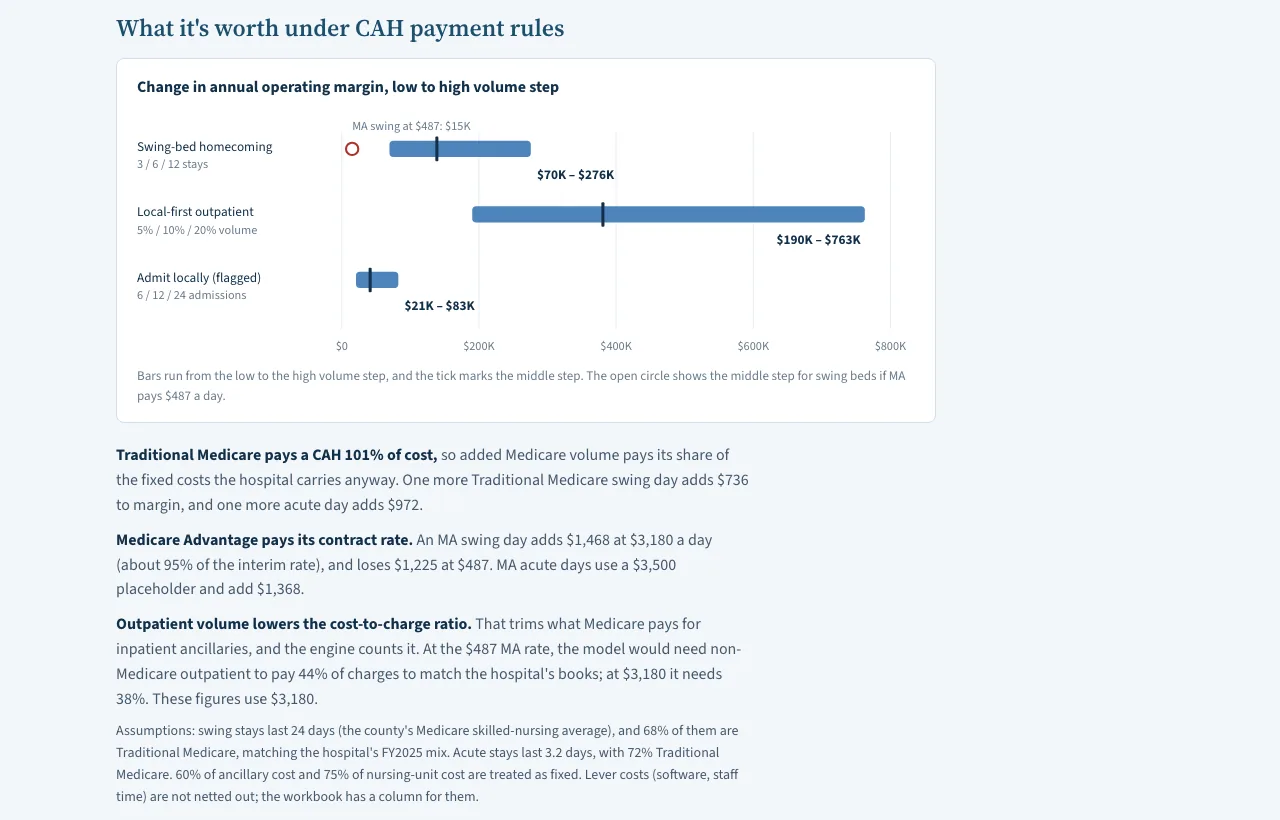
Medicare Advantage contract rates decide whether the top move pays, so the briefing shows the answer at more than one rate.
It shows its work
The output is a one-page CEO briefing and a workbook that sources every figure. The cost of each move, such as software and staff time, is left for the hospital to enter.
CMS’s Hospital Service Area File counts include Medicare Advantage stays. That makes them run well above the fee-for-service discharge counts for the same hospitals, so the two can’t be compared line for line.
03 · What a run produces
A sample briefing, with invented numbers.
The repository includes a full sample report for a fictional 22-bed critical access hospital. It shows the format a real run follows.
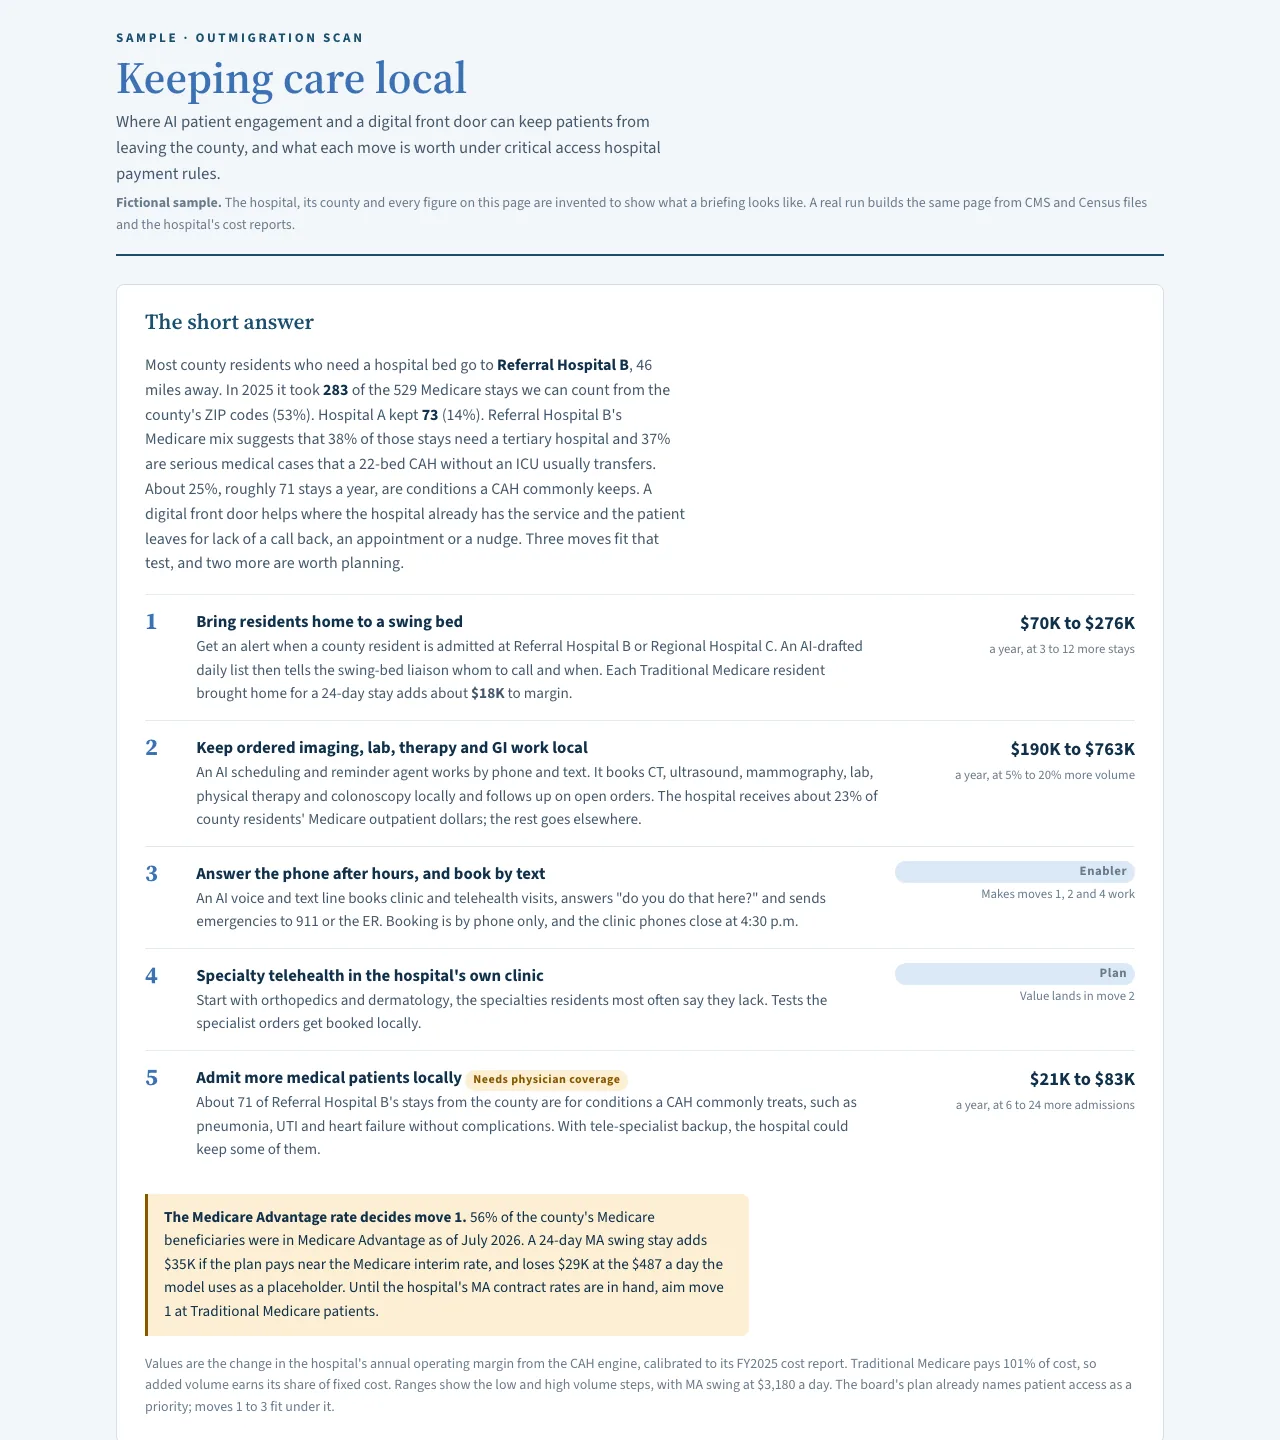
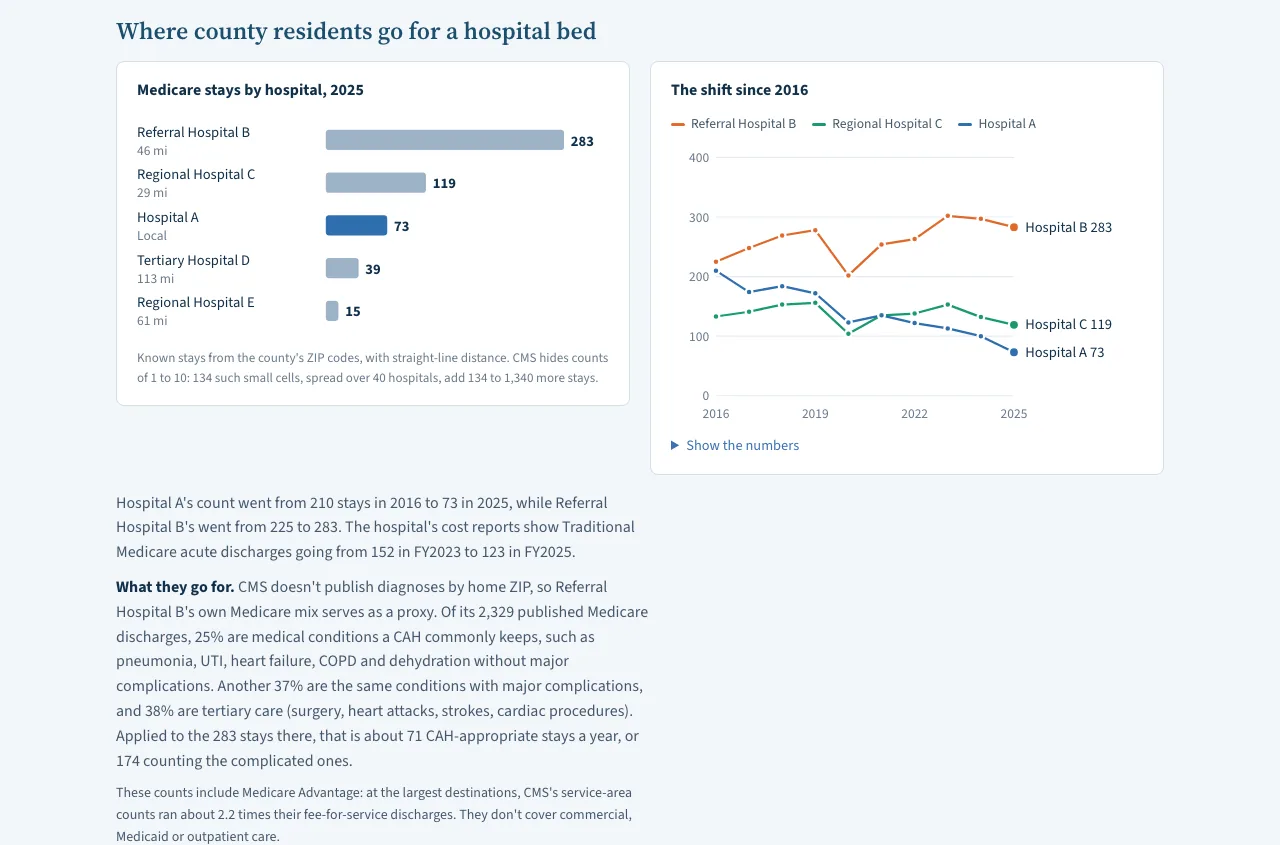
In the sample, the top referral hospital is 46 miles away. It took 283 of 529 countable Medicare stays (53%). The local hospital kept 73 (14%), down from 210 in 2016.
At least $6.9M a year in fee-for-service outpatient dollars goes elsewhere.
16% of the county’s households have no internet, against 8% statewide, so the sample recommends voice and text first.
The sample also shows why the Medicare Advantage rate matters. The top move loses about $29K per stay at a nursing-home-level rate, and adds about $35K at a rate near the Medicare interim rate.
Open the sample onlineIn the fictional sampleFive moves, ranked
- 1. Swing-bed return: $70K–$276K a year.
- 2. Local imaging, lab, therapy, and GI: $190K–$763K a year.
- 3. After-hours phone and text booking: the enabler for moves 1, 2, and 4.
- 4. Specialty telehealth in the hospital’s own clinic: its value lands in move 2.
- 5. More local medical admissions: $21K–$83K a year, flagged because it needs physician coverage.
04 · Limits
What the scan can’t tell you.
These come from the project’s own documentation. Read them before you take a number to your board.
- The sample numbers are invented. They illustrate the format only.
- CMS publishes no diagnoses by home ZIP code, so the destination hospital’s own Medicare mix stands in for what patients went there for.
- Service-area counts cover Medicare only, both fee-for-service and Medicare Advantage. Commercial, Medicaid, and outpatient destinations need the hospital’s own data.
- Medicare Advantage contract rates are placeholders until the hospital enters its own. The volume steps for each move are assumptions, shown as ranges.
- The cost of each lever, such as software and staff time, is left for the hospital to enter.
Run it on your own county.
The code and the sample report are on GitHub. Hospitals and health systems may run and modify the tool to assess their own outmigration, for internal use.